Important tool updates - Learn more
- Learn
-
Articles
Read about influencer marketing
-
Growthnotes - Newsletter
Insights for the modern marketer
Most marketing teams track dozens of metrics, yet struggle to show which ones actually impact revenue. You might already track website traffic, social media engagement, or form fills, but those numbers alone don’t show what’s actually working. The pressure to justify marketing spend, align with sales, and deliver measurable outcomes is higher than ever.
That’s where sharper tracking makes a difference.
For example, when our team at inBeat worked with Dashing Diva, we expanded their paid strategy from 3 to 7 channels (including programmatic) through assets like this:

Or this:
Even better, we doubled their ad budget, and cut CAC by 24%. That kind of improvement starts with knowing which numbers to trust.
In this article, you’ll get a focused breakdown of B2B marketing metrics that connect directly to business results, so you can avoid wasting time on metrics that don't really matter.
So, let’s start by getting clear on what these metrics are.
Most teams track too many metrics without proving revenue impact.
The right metrics guide budget allocation, improve sales alignment, and show marketing’s contribution to growth.
Common tracking challenges include disconnected platforms, unclear lead definitions, and unreliable attribution models.
Key Metrics to Prioritize:
Action for B2B Leaders:
B2B marketing metrics are the data points that help you measure how your marketing strategies support pipeline and revenue.
Side note: When talking about B2B SaaS marketing metrics, we don't mean following your KPIs.
Key performance indicators (KPIs) show big-picture outcomes such as profit or retention. Metrics, on the other hand, look at what drives those results, such as channel performance or conversion steps.
That difference matters when you're optimizing campaigns.
When metrics are aligned to business outcomes, they help you prioritize what to improve, what to invest in, and how to report impact.
To learn more, you can also watch this YouTube video:
For example, we helped EVRY launch their app and aligned their account to app best practices. We tracked key metrics like ROAS, which ended up increasing by 5x. As a result, they scaled ad spend with greater confidence.
Here are some of the assets our team created for them:

These images are pretty, but they have lots of work behind them. Plus, they performed extremely well because we tied them to key metrics.
So, let’s find out why tracking the right metrics is more important now than ever.
When you focus on the metrics that matter, you gain control over how marketing drives revenue. Reliable metrics help you decide where to allocate budget, what needs adjustment, and which areas are ready to grow.
The right B2B marketing metrics give you:
This also helps you lead your team with accountability and show where efforts are working and where to adjust. The proper metrics can give you clear direction. That clarity lets you confidently reallocate budget, double down on high-performing channels, and course-correct when conversion rates or pipeline quality dip.
But all of this makes you wonder...
Tracking is only useful if your metrics are accurate and trusted, but that’s a challenge for many teams. According to Forrester’s Marketing Survey 2024, 64% of B2B leaders don’t trust their own marketing measurement to make decisions.
And in long-cycle models, early reporting usually misses true ROI, especially when your average deal takes 9-18 months to close.
You might be facing problems like:
Without fixing these, you risk building plans on false positives.
Here’s a quick example of the metrics we typically track for our client Hurom’s ad variations:
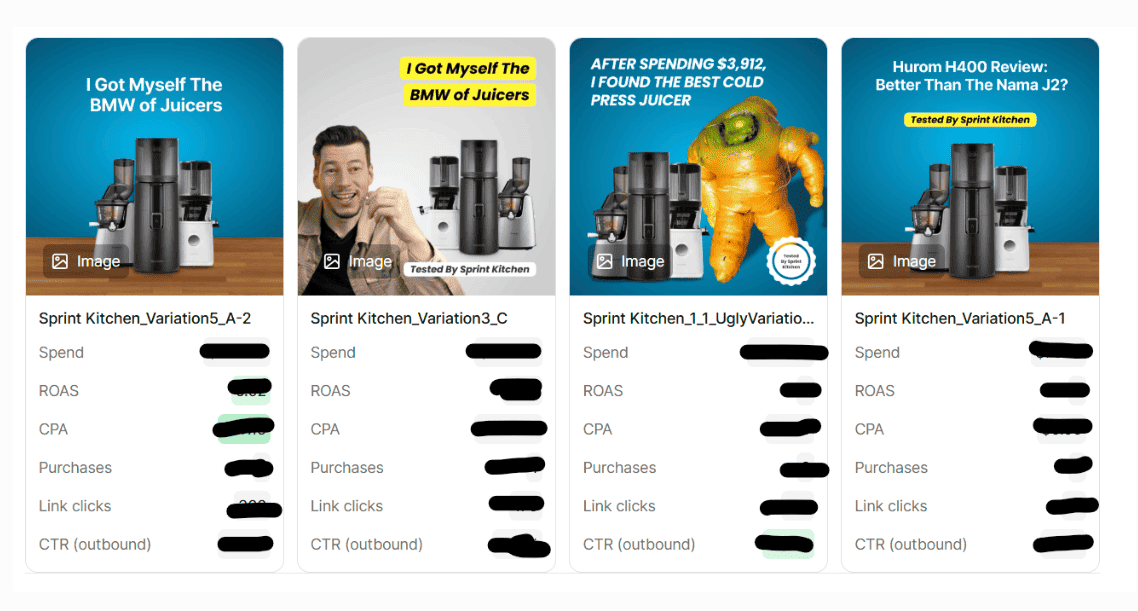
This brings us to the next point.
When you're responsible for results, tracking the right numbers is how you make smarter decisions, guide your team, and prove impact. Here are the metrics that help you connect your work to revenue, spend, and growth.
Customer Acquisition Cost (CAC) tells you how much it takes to acquire a new customer. It’s one of the most important B2B marketing metrics because it impacts profitability, payback period, and overall growth strategy. If your CAC rises while customer value stays flat, your margins shrink and growth slows.
CAC formula: Total sales and marketing spend ÷ number of new customers
B2B benchmarks put the average CAC around $536. So, to stay efficient, you should track CAC by channel. That way, you can reallocate budget toward sources that bring in high-value customers at lower cost.
Pro tip: Struggling to keep CAC under control? Our 21 ways to lower CAC guide breaks down practical tactics you can apply right away.
Customer Lifetime Value (CLV) estimates the total revenue you can expect from a customer over the entire relationship. It helps you understand how your business grows, how profitable it is, and what return you can expect over time.
CLV formula: (Average purchase value × frequency) × customer lifespan
A 3:1 CLV-to-CAC ratio is considered strong.
And when your CLV is high, you can afford to invest more in acquisition.
Despite its impact, though, only 42% of companies accurately measure CLV. So, getting this number right changes how you forecast and fund growth.
Cost Per Lead (CPL) measures how much you’re paying to bring in each new lead. It’s important for optimizing lead generation and managing your marketing spend with intent.
CPL formula: Total lead gen spend ÷ number of leads
In 2025, B2B CPL benchmarks range from $65-$250, depending on the industry and channel.
If you want to lower your CPL, you have to do it correctly.
First, understand what you’re getting for the cost. A $200 lead from paid search may convert 3x better than a $75 lead from social media ads.
Of course, we found that using creator-generated content is a great way to fight ad fatigue and reduce CPL as a result.
Pro tip: Cost per lead is only one side of the coin. To get the full picture, you’ll want to benchmark against other KPIs. Our 60+ lead generation statistics article is a solid starting point.
Lead-to-close rate shows the percentage of leads that eventually become paying customers. It helps you understand the quality of your pipeline and how well your team turns interest into revenue.
Lead-to-close rate formula: (Closed deals ÷ Total leads) × 100
For website-based leads, conversion rates for B2B businesses typically average around 2.23%, but the top 25% of the performers can reach 4.31% or higher.
If your rate is consistently low, you may have weak lead qualification or poor sales-marketing alignment. We advise you to segment by channel or campaign to prioritize high-intent sources and mitigate this problem. That’s the first step to reduce waste across your marketing funnel.
MQLs are leads that meet specific criteria based on behavior, fit, or intent and are ready to pass to sales. Tracking MQLs helps you measure how effective your marketing efforts are at bringing in potential buyers who are actually a good match.
MQL formula: (MQLs ÷ Total leads) × 100
For B2B SaaS companies, that rate sits around 39%. If you’re seeing lower numbers, revise your lead scoring model. Or, even better,re-evaluate your offer’s alignment with user intent on key landing pages.
SQOs are leads that both marketing and sales agree show strong buying intent. This metric ties directly to pipeline health and revenue forecasting.
SQS formula: (SQOs ÷ Sales Qualified Leads) × 100
Conversion rates from SQL to Opportunity typically fall between 50% and 62% across B2B companies. To improve this metric, you’ll need strong lead qualification criteria, clear sales enablement processes, and regular feedback loops between teams.
A consistent drop here could mean your pipeline looks full on paper, but isn’t filled with buyers who are ready to move forward.
Pipeline velocity measures how quickly qualified opportunities move through your pipeline and turn into revenue. It’s a strong indicator of revenue momentum and helps you forecast more accurately across campaigns and channels.
Pipeline velocity formula: (Deals in pipeline × average deal size × win rate) ÷ average sales cycle length (in days)
A win rate above 50% is generally a sign of a well-aligned sales process. If your velocity slows, check for delays in handoffs or poor-fit leads. Segment by product, persona, or region to spot bottlenecks. This metric is especially useful when aligning marketing goals with sales planning and setting realistic revenue targets.
MRR is the predictable income your business earns each month from subscriptions. It’s a key measure for financial health and helps you model growth, assess churn, and support product or pricing changes.
MRR formula: Number of active customers × average monthly revenue per account (ARPA)
For context, top-performing SaaS companies saw quarterly MRR growth between 85% and 152% from 2022 to 2024, according to ChartMogul's benchmarks. A flat or shrinking MRR trend signals issues in customer retention or expansion. If you want to fix it, try tracking changes by customer segment or campaign to see what’s driving your recurring revenue and where to double down.
Churn rate shows the percentage of customers you lose in a given period. Negative churn happens when expansion revenue exceeds lost revenue. It signals strong account growth and steady customer value over time.
Formula for customer churn rate: (Number of customers lost ÷ total customers at start of period) × 100
Example for Negative Revenue Churn:
Revenue churn rate = ($5,000 – $8,000) ÷ $50,000 × 100 = -6%
That -6% reflects negative churn, which is a strong signal that expansion revenue is outpacing losses, which contributes to sustainable growth.
According to Recurly’s 2025 data, the average churn rate for B2B SaaS is 3.8%. If yours is higher, investigate onboarding gaps or poor product fit. On the flip side, tracking upgrades, cross-sells, and renewals can help you drive negative churn. This metric directly affects your monthly recurring revenue and average customer lifetime value.
Traffic-to-Lead Ratio tells you how well your website traffic converts into leads. A low ratio could mean you're attracting the wrong audience or failing to capture interest. It's one of the clearest signals for assessing your content’s ability to attract qualified prospects.
Traffic-to-lead ratio formula: (Number of leads ÷ website visitors) × 100
A strong content strategy typically generates a 2%-4% traffic-to-lead ratio. If your percentage is lower than that, you should revisit your landing pages or calls to action.
Testing intent-based content across paid ads or SEO can help lift performance and guide content strategy.
Attribution by channel shows how different touchpoints contribute to conversions across the customer journey.
Multi-touch attribution models give you a clearer picture of how various marketing activities work together. This helps you allocate spend more effectively and cut underperforming channels.
You can use tools such as Google Analytics 4 or attribution modeling platforms to compare weighted influence across campaigns. Choosing the right model (linear, time decay, U-shaped) depends on your funnel length and sales cycle.
Consistent attribution tracking helps you defend budget and improve return on marketing investment.
Pro tip: Still wrestling with attribution? Media mix modeling is becoming the go-to approach for B2B teams. Our media mix modeling guide shows how to connect spend with true revenue impact.
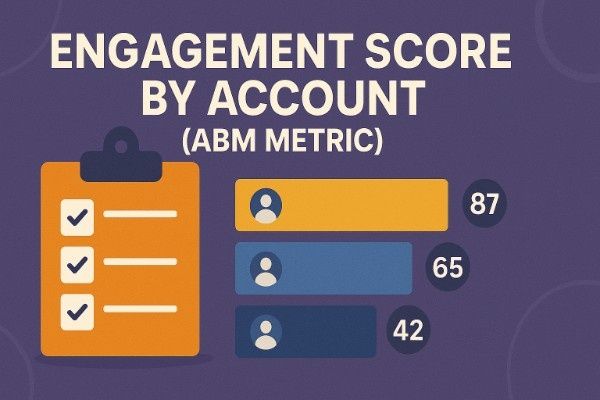
ABM metric measures how active your target accounts are with your content, ads, and outreach. It’s crucial for account-based marketing because it shows whether the right people are interacting with your brand.
Formula: Engagement score = sum of weighted engagement actions per account
As a side note, we strongly advise you to consider this tactic.
Companies who integrate this into their marketing mix, typically see 20%-30% higher account engagement than non-ABM programs. That lift translates into better sales alignment and a more predictable pipeline. For better insight, you can segment engagement by buying stage or stakeholder role.
You can weigh actions such as page visits, email clicks, webinar sign-ups, and meeting bookings.
Sales cycle length tracks how long it takes for a lead to become a closed deal. It helps you identify friction in your process and improve speed to revenue. When deals drag out, your pipeline clogs, and sales efficiency drops.
Sales cycle length formula: (Total number of days to close each deal ÷ number of deals)
From our experience, it’s true that about 30% of B2B deals close in one to three months. Longer timelines may signal low-fit leads or gaps in sales enablement.
So, you can break this metric down by persona, channel, or deal size to uncover patterns and shorten time-to-close across your marketing and sales engine.
ROAS tells you how much revenue you earn for every dollar spent on advertising. It’s a direct measure of paid ads performance and helps you judge which channels actually generate profit and not just clicks.
ROAS formula: (Revenue from ads ÷ ad spend) × 100
A healthy ROAS typically ranges from 200% to 400%. If yours falls below that, dig into targeting, creative, and landing page experience. Use platform data from Google Ads or LinkedIn to compare performance across campaigns and make better budget decisions.
Net Promoter Score measures customer loyalty by asking how likely someone is to recommend your product or service. NPS connects marketing efforts to long-term brand trust and revenue from referrals.
NPS formula: % Promoters – % Detractors
B2B companies usually see NPS scores between 37 and 69. A falling score can signal declining customer experiences or product value.
You should use feedback tools and customer surveys to regularly track changes and uncover actionable insights. A higher NPS can improve retention and strengthen your brand’s credibility through word-of-mouth referrals.
Pro tip: NPS feeds directly into customer loyalty and retention. For SaaS companies, we also mapped out 19 winning B2B SaaS marketing strategies that actually work. This is useful for turning promoters into long-term advocates.
Website conversion rate measures how many visitors complete a desired action, such as booking a demo, signing up, or filling out a form. It shows how well your website turns traffic into real pipeline movement. A strong rate signals high-quality offers, copy, and user experience.
Website conversion rate formula: (Number of conversions ÷ total website visitors) × 100
According to WordStream analysis, B2B marketers usually see an average conversion rate of 2.23%, while the top 25% reach over 4.3%. To improve, you should test CTA placement, simplify forms, or align messaging with buying intent. Prioritize conversion-focused updates over chasing vanity metrics such as raw web traffic.
This is one of the top B2B content marketing metrics that helps you track how much of your marketing content is actively used by the sales team. It reflects how aligned your messaging is with real buyer conversations, and how well you support the full customer journey.
Formula: (Number of content assets used by sales ÷ total assets created) × 100
When content sits unused, it drains resources and weakens message consistency. A recent Forrester report shows 65% of marketing content never gets used. That gap usually comes from a lack of collaboration or an unclear enablement strategy. You can use tools such as Highspot or Showpad to improve content visibility and adoption.
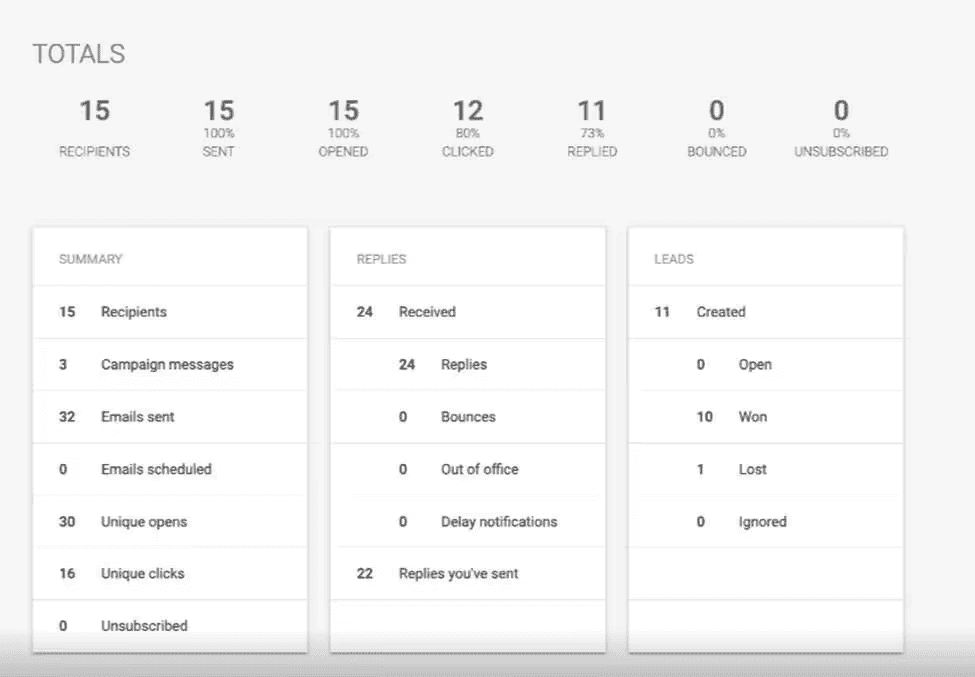
Email metrics such as open rate, click-through rate (CTR), and response rate give you insight into how effectively your messaging drives action. While opens measure interest, clicks and replies get you closer to revenue.
Open rate formula: (Emails opened ÷ emails delivered) × 100
CTR formula: (Clicks ÷ emails delivered) × 100
Response rate formula: (Replies ÷ emails delivered) × 100
According to 2025 data, average B2B email open rates are 42.35%, with CTRs around 2% and cold outreach response rates at 5.8%.
To improve performance, start by segmenting your audience more precisely, writing clear subject lines, and making sure each message speaks directly to your reader’s priorities.
As a side note, here are some of our in-house email metrics at inBeat Agency:
Share of Voice (SOV) tells you how much visibility your brand has compared to competitors across specific channels. It reflects your market presence, which influences pipeline potential and brand preference over time. SOV is typically tracked across paid and organic channels, PR, and social media.
Share of voice formula: (Your brand’s impressions or mentions ÷ total impressions or mentions in market) × 100
SOV below 10% usually suggests low brand visibility, while surpassing 30% signals solid traction. Some B2B marketers aim for 50%+ to lead their category.
All in all, you should prioritize high-share channels to stay competitive without spreading your spend too thin.
Marketing-influenced revenue measures the percentage of closed deals that were touched by marketing at any stage. It connects your team’s efforts to bottom-line results and helps you align resources with what's working. This is especially important in complex B2B SaaS buying journeys where multiple interactions happen before a deal closes.
Marketing-influenced revenue formula: (Revenue from influenced deals ÷ total revenue) × 100
A recent survey by Ruler Analytics found that 84% of marketers believe their work impacts revenue, but belief alone doesn’t prove value. To quantify this metric with confidence, you need reliable attribution models, clean CRM data, and close alignment with your sales team.
Pro tip: Measuring marketing’s real impact can be messy. If you’re scaling and need outside expertise, our list of the top 15 marketing measurement and analytics companies is worth checking out.
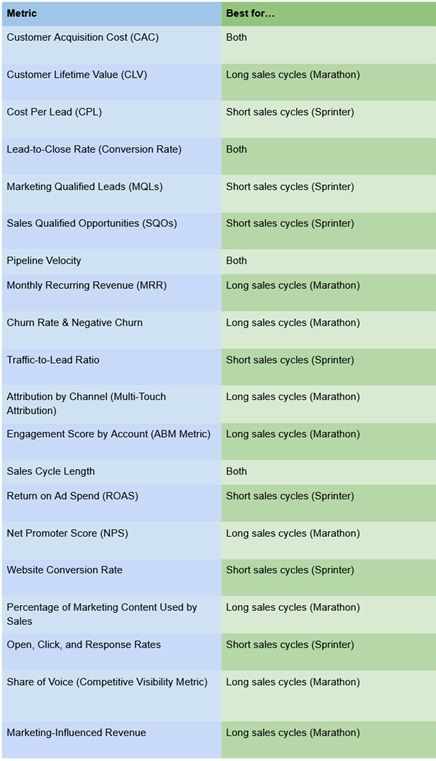
Not all metrics carry equal weight across every business model. The ones you track should reflect how your sales motion actually works. If your cycle is fast and transactional, metrics such as conversion rate, MQLs, or ROAS matter most. But if you’re managing a longer, multi-touch buyer journey, retention, engagement, and revenue attribution become far more relevant.
Use the table below to align your metric focus with the type of sales cycle you run.
The metrics you’ve just seen are the ones CMOs, RevOps, and performance teams rely on to defend budgets, shape strategy, and stay accountable to revenue. Now’s a good time to audit what you’re tracking. Drop the vanity data that doesn’t tie back to growth, and double down on signals that move pipeline and profit.
If you're looking to scale performance through better content, paid reach, or creator-led campaigns, inBeat can help.
Book a call to see how we help fast-growing brands improve the inputs that fuel the metrics that matter.
They include pipeline-focused data points such as Customer Acquisition Cost, MQLs, SQOs, and conversion rate, along with revenue metrics such as MRR, churn, and ROAS. These metrics help you measure impact and tie marketing to revenue.
The classic 7 Ps (Product, Price, Promotion, Place, People, Process, and Physical Evidence) still apply. They guide how you position your offer, align teams, and scale efficiently.
It’s the idea that only 5% of your target market is ready to buy right now. The other 95% will buy later, so your long-term strategy should build brand and trust.
B2B marketing typically includes product-based, service-based, software/SaaS, and reseller/channel-based approaches, each with its own tactics, cycles, and key performance signals.