Important tool updates - Learn more
- Learn
-
Articles
Read about influencer marketing
-
Growthnotes - Newsletter
Insights for the modern marketer
You make decisions every day that shape growth, such as allocating budgets, testing ideas, and adjusting pages. But the truth is that those choices can’t depend on instinct alone. To be successful, you need data that explains why users convert, hesitate, or drop off.
You’re on the right page for that.
Conversion rates can help you find out the real behavior patterns that impact ROI. And conversion rate optimization is how you maximize those numbers.
But to get it right, you need to have the right benchmarks.
That's why, in this article, you’ll see what today’s CRO statistics say about user behavior and how they guide better optimization decisions.
Let’s begin with the key statistics that matter most for conversion rate optimization.
These CRO statistics below break down the patterns shaping performance today.
That includes everything from page speed and personalization to testing and UX. Let’s look at the key categories that reveal where real optimization impact begins.
The data behind conversion optimization shows how much performance can vary across channels, audiences, and industries.
DemandSage reports that global averages for conversion rates in 2025 sit around 2.9%. The global average across all websites is slightly higher at 3.68%. This range confirms what you likely see in your own dashboards (benchmarks differ based on acquisition mix and intent).
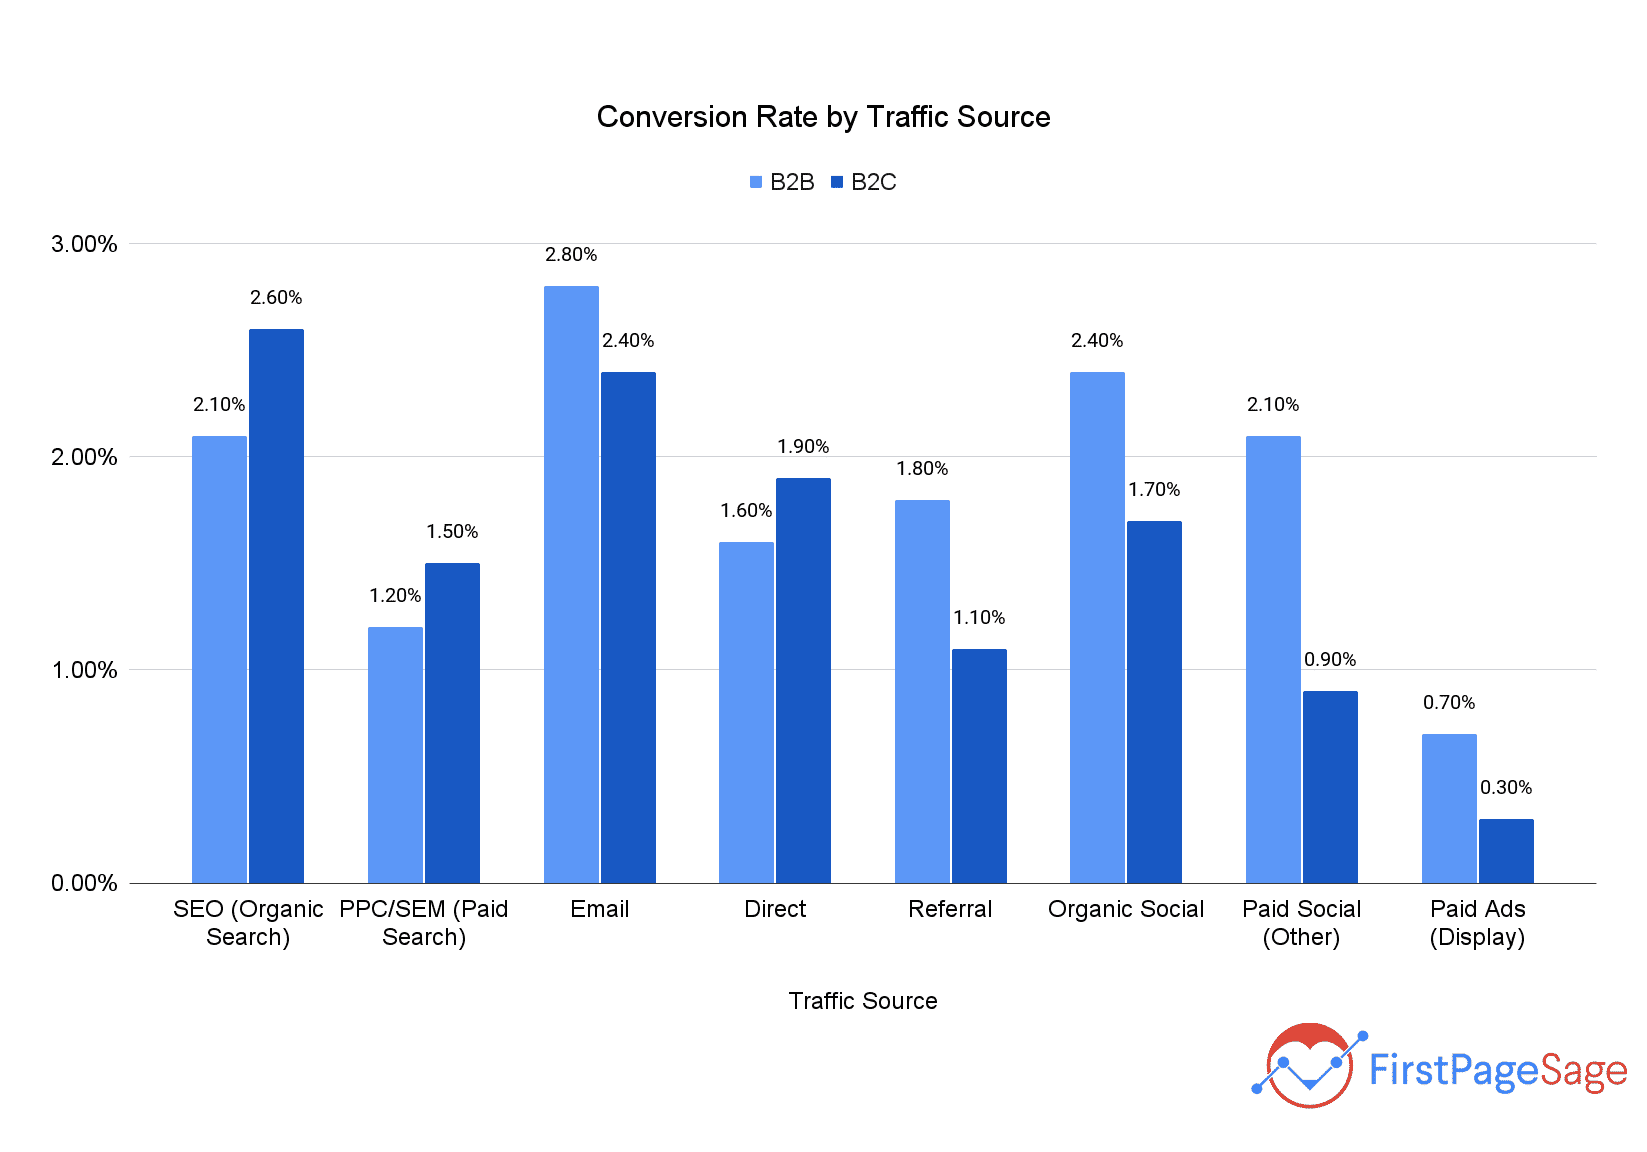
FirstPageSage shows just how sharp those gaps can be.
In B2C, email marketing conversions average 2.8%, compared to 2.4% in B2B email marketing conversions. From organic search, B2C averages about 2.1%, while B2B performs slightly better at 2.6%.
Paid search trails at roughly 1.2% for B2C and 1.5% for B2B, whereas paid social media campaigns average 2.1% and 0.9%, respectively. These differences show why channel-level testing and budget alignment are critical.
On the landing page side, Unbounce notes that top performers in the upper 25% reach a conversion rate of 11.4% or higher. For SaaS specifically, Databox reports median conversions of 7.84%, with the top quartile nearing 14.9%.
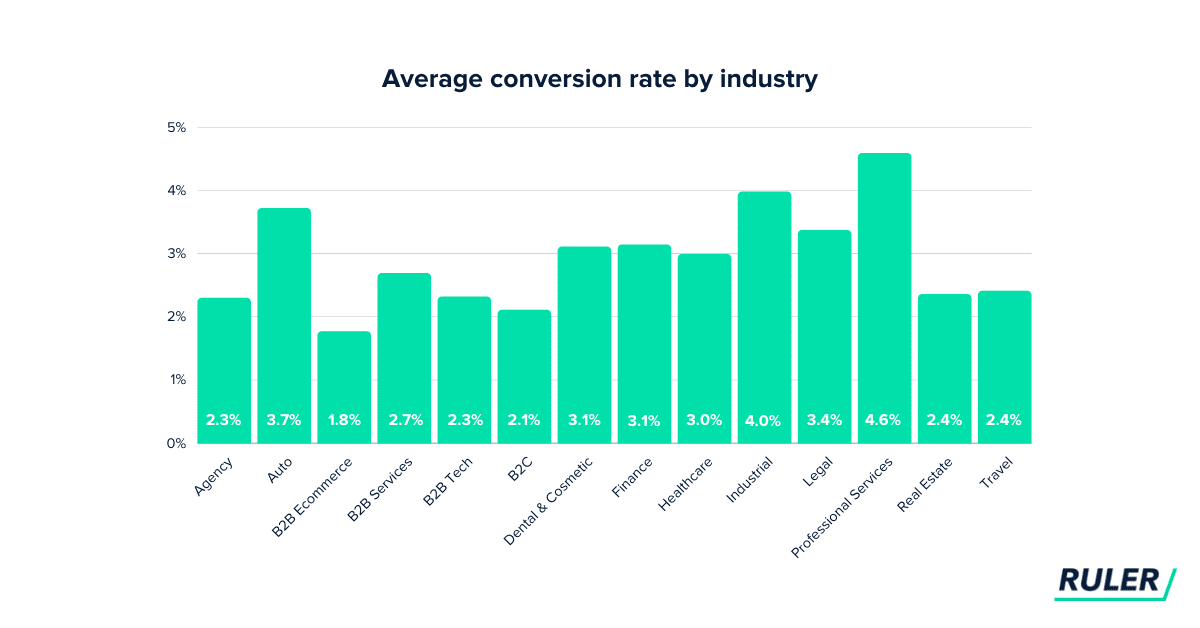
Also, industry benchmarks from RulerAnalytics further confirm how industry context/ niche shapes performance. You can expect from 1.8% in B2B eCommerce conversion rates to 4.6% across professional services.
Finally, SQ Magazine found that teams investing in CRO tools earn an average ROI of 223%. This proves that optimization is a measurable driver of revenue growth.
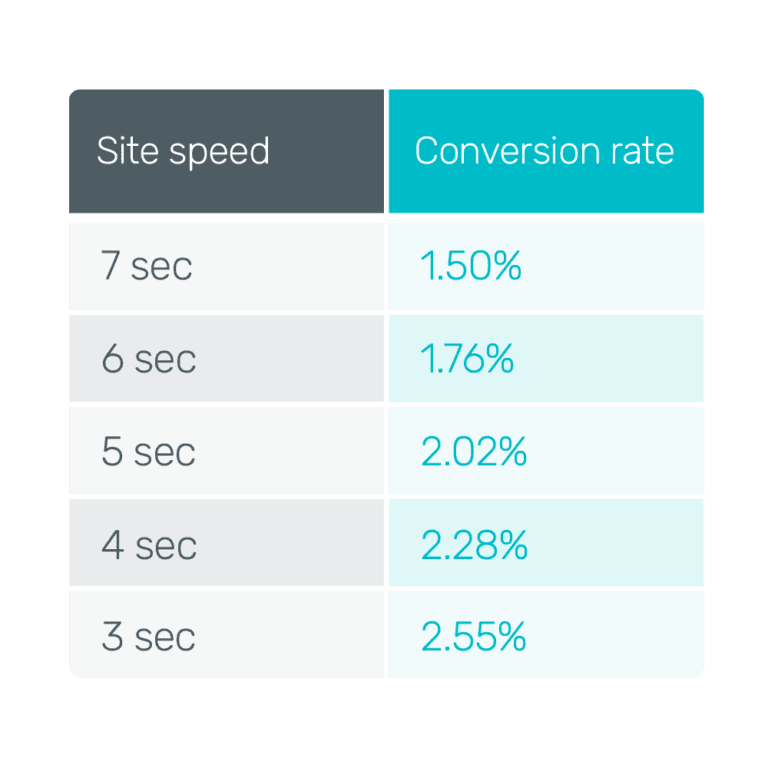
Website speed has a measurable impact on conversions and revenue.
A one-second delay in page load can cut conversions by 7%, according to some sources. By comparison, research from Bidnamic shows that for every second faster a site loads, conversion rates can improve by up to 17%.
While sources don’t agree on an exact number, something is clear: even minor friction changes how website visitors engage, move through the sales funnel, and complete purchases.
Performance gaps are different, though equally clear, in data from Email Vendor Selection.
According to this source, the fastest pages (loading in 1 second or less) see conversion rates of around 3.05% for e-commerce sites. When load times reach 2 seconds, this figure goes to 1.68%. This delay might look small, but at scale, it means lost transactions and lower ROI.
The same pattern holds for engagement metrics.
Serotonin reports that when load time grows from 1 to 3 seconds, the chance of a bounce jumps by 32%. ToolTester adds that from 1 to 10 seconds, bounce rate probability increases by 123%.
Pro tip: If you need to understand how loading time affects engagement and lost conversions, use our Bounce Rate Calculator. It helps you estimate the real impact of slow pages on revenue and performance.
Portent’s findings confirm the trend. E-commerce sites loading in one second convert 2.5x better than those taking 5 seconds.
For you, this means that site speed is also a business metric.
Every second saved through smarter website optimization directly supports conversions, retention, and long-term growth.
The shift toward mobile devices continues to reshape conversion behavior. Data from MobiLoud shows that mobile accounts for 62.45% of global internet traffic, while desktop holds 35.71%.
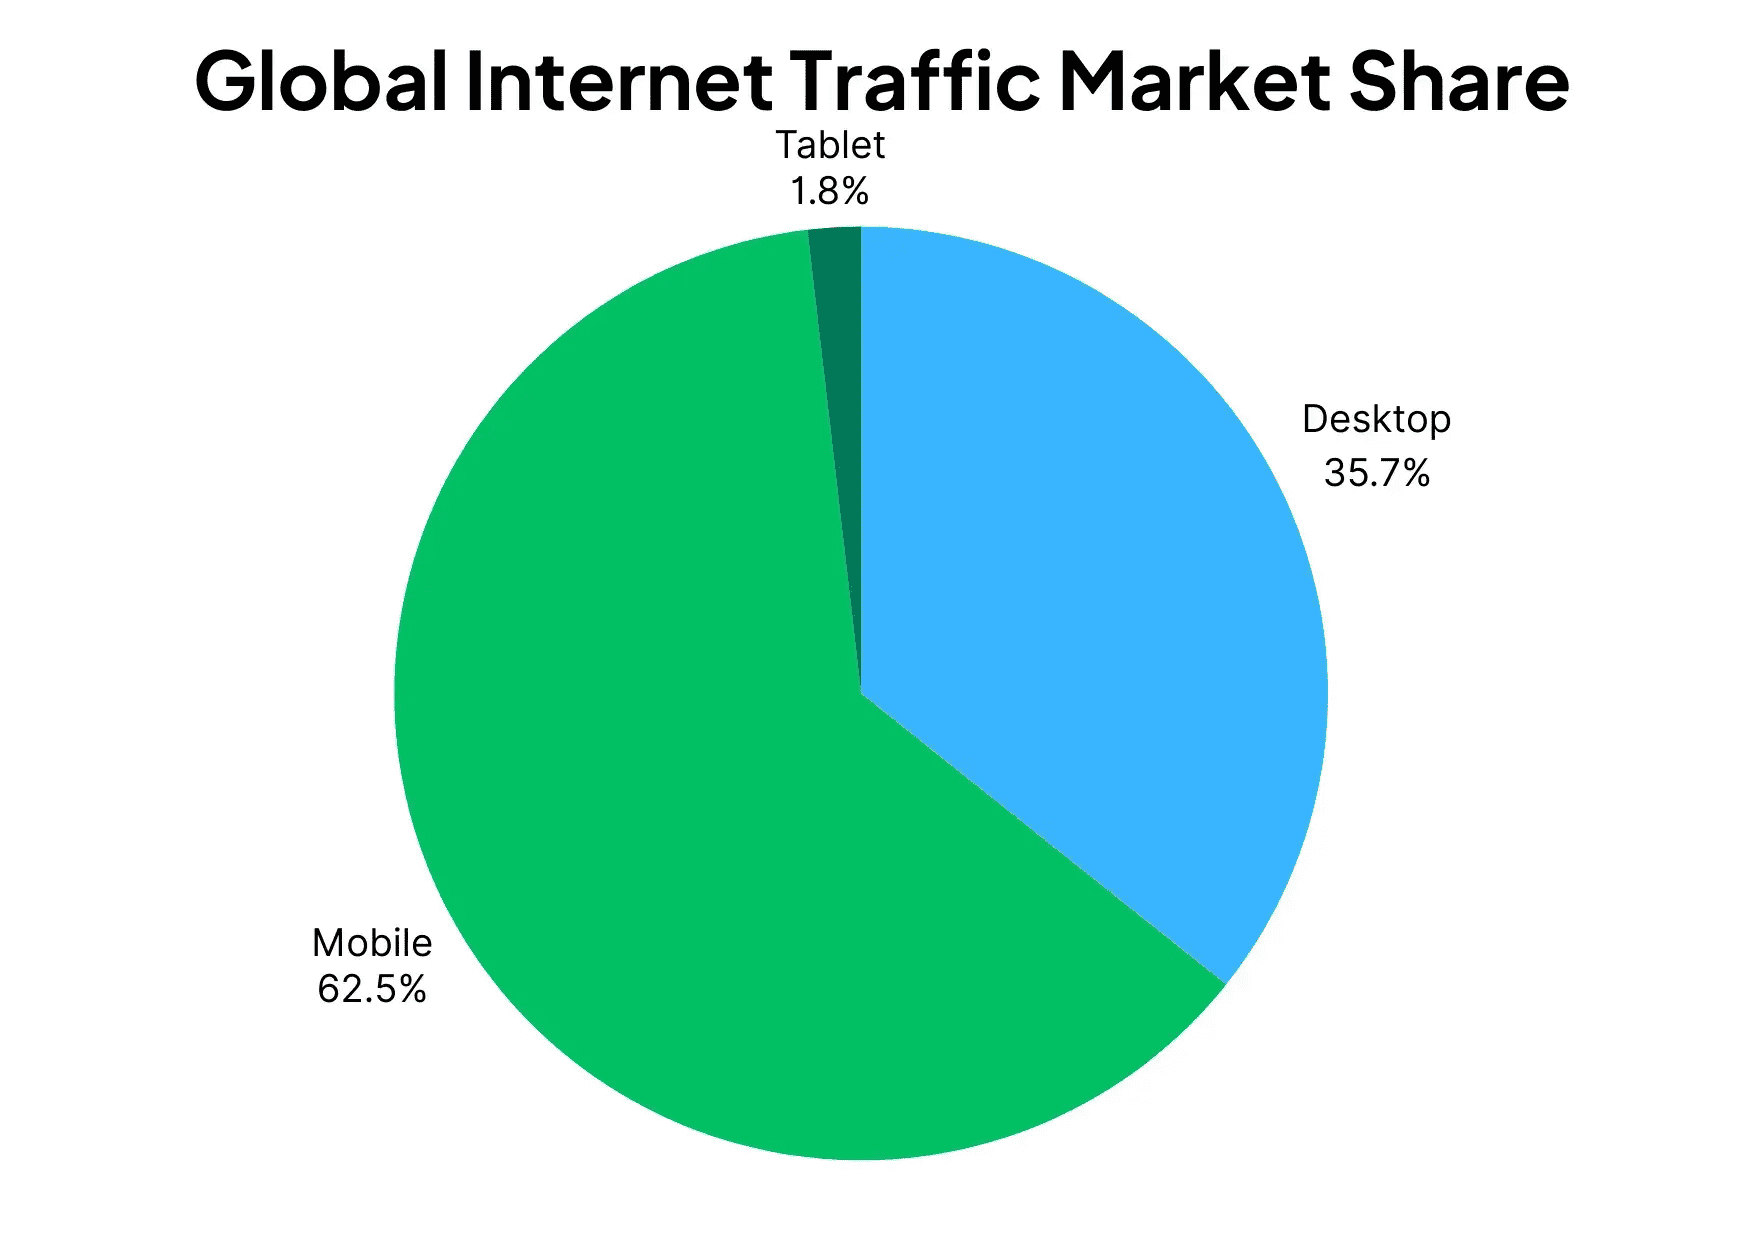
Yet despite the traffic difference, SQ Magazine reports that desktop still outperforms in conversions (4.3% compared to 2.2% on mobile). That performance gap shows how smaller screens, slower load times, and fragmented sessions still influence user experience and buying intent.
One reason behind that gap could be checkout behavior.
Shopify’s research shows cart abandonment on mobile reaches 85.65%, compared to 73.76% on desktop. That’s because on mobile, people may experience more friction within shopping carts and forms that aren’t fully optimized for touch navigation.
However, solutions like Progressive Web Apps (PWAs) are helping close that gap. Front-Commerce notes that brands adopting PWAs see 8% more mobile conversions, 15% higher desktop conversions, and 60% fewer bounces.
In fact, PWAs can increase conversions by up to 52% compared to traditional responsive web design. This shows how modern performance frameworks drive measurable CRO results.
Small design choices in your checkout flow can make or break conversions. Research shows that cutting form fields from 4 to 3 can lift completion rates by as much as 50%.
Sleeknote’s data adds that single-field forms convert at 4.41%, while adding just one more field drops performance to 2.9%. The takeaway is clear: every extra step creates friction that slows the customer journey and lowers your overall add-to-cart rate.
As such, checkout design remains one of the biggest barriers to growth.
And it’s one that brands don’t seem to want to overcome.
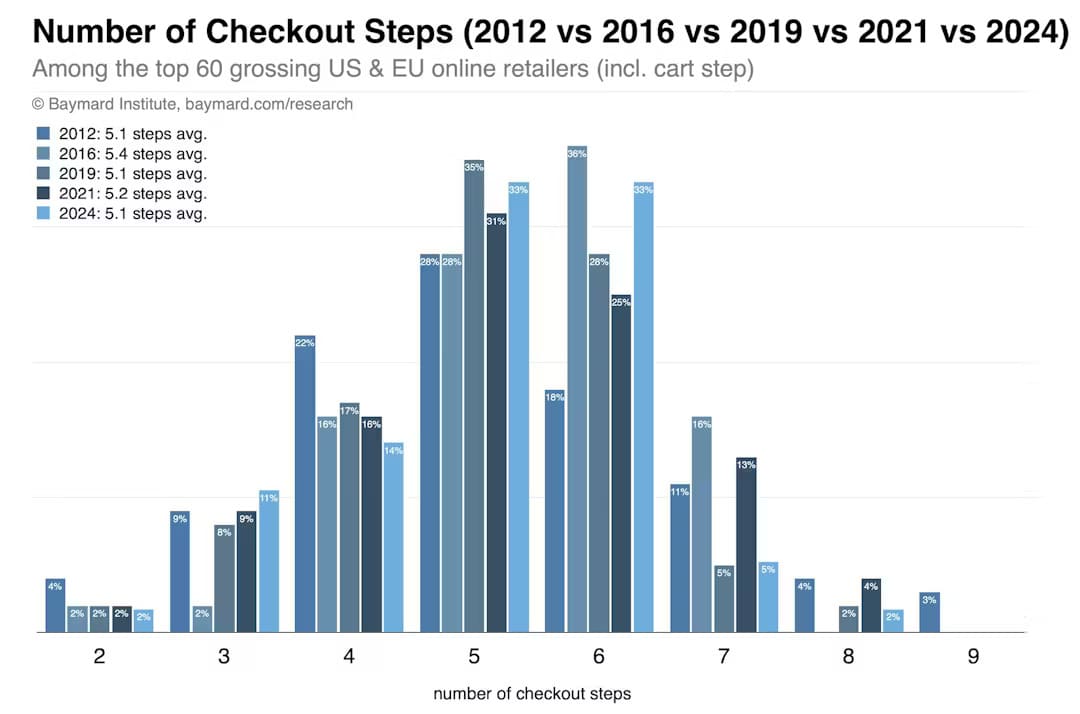
The Baymard Institute found that the average checkout contains 11.3 form fields and 5.1 steps. This leads 18% of users to abandon their carts due to complexity.
Again, this shows why reducing form clutter is a direct lever for ROI.
How can you get back lost users to improve CRO?
To re-engage lost users, behavioral triggers like the exit pop-up still deliver measurable results. OptinMonster reports that merchants have recovered 21% of abandoned carts with exit-intent popups.
Conversely, OpiMonk’s analysis shows cart abandonment popups convert at 17.12%, feedback popups at 12.62%, and email signups between 5.10-7.65%.
Even if the numbers are not exactly the same, the lesson stands:
Every optimized form and recovery touchpoint leads to a smoother customer experience and higher checkout completion rates.
Personalization continues to prove its value as one of the most effective conversion optimization levers.
Sender’s data shows that personalized call-to-action buttons convert 202% better than generic ones. Meanwhile, Instapage found that it turns 42% more visitors into leads compared to untargeted CTAs.
This difference shows how context and timing can turn passive interest into active engagement.
The impact scales even further with the use of automation.
Cropink reports that AI-driven personalized product recommendations can lift conversions by 15-20%. Meanwhile, McKinsey found that personalization powered by AI can generate up to 40% more revenue for brands.
When personalization adapts dynamically (based on visitor behavior), the lift becomes even more substantial. Envive’s benchmarks show that dynamic content personalization can drive up to an 89% increase in purchases.
VWO’s findings reinforce the trend. Its research shows that 94% of companies using website personalization saw higher conversions. Also, in-house teams achieved an average of 19% sales uplift.
These numbers confirm what you may already suspect. Integrating AI and personalized recommendations into your testing stack is a measurable business advantage.
Visual trust signals are some of the strongest drivers of conversion. SQ Magazine found that adding video content to product pages can increase conversions by up to 86%.
Similarly, Vidico reports that including a video on a landing page can lift performance by more than 80%. These findings show how motion and storytelling build credibility faster than static visuals alone.
Social proof amplifies that trust.
Research from SQ Magazine shows that displaying customer reviews or ratings can increase conversions by up to 270% in some controlled settings. PowerReviews adds that pages with at least one review see a 52.2% conversion lift compared to those without any.
The effect extends beyond written feedback.
Testimonials raise conversions by an average of 34%. Also, 93% of buyers say customer reviews influence their decisions, according to The State of Community Powered Marketing report.
Trust indicators also affect perceived security.
Yieldify found that 48% of shoppers feel reassured by trust badges. Also, 72% say they trust user-generated content, such as authentic customer images, more than stock photography.
Together, these elements strengthen credibility and improve the customer experience. This can help you reduce hesitation, increase click-through rate, and convert intent into measurable results.
Direct customer interaction plays a measurable role in conversion performance.
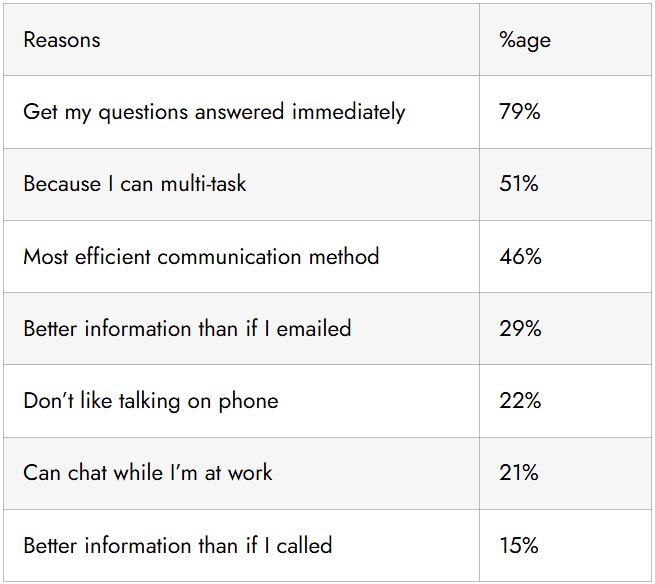
Businesses that implement live chat report an average 20% increase in conversions. Also, those that use chat to assist customers during checkout see results climb by up to 40%.
Chat users are also 2.8x more likely to convert than non-chat users.
This just shows how real-time guidance can reduce hesitation and improve eCommerce sales outcomes. Here are the reasons why it works:
AI-driven solutions amplify that impact even further.
E-commerce sites using chatbots report a 7-25% sales lift. Those deploying AI-powered assistants see conversion rates rise by 23% compared to sites without them.
Pro tip: When these conversations are personalized (especially on mobile), the lift can reach 30%.
That’s because contextual dialogue meets users where they are in their decision process, which improves both trust and completion rates.
Of course, you need to constantly optimize your chatbots.
In one case study, refining chatbot targeting and response models led to 168% more qualified leads within a month. This data shows that real-time interaction is a proven way to improve ROI and speed up the customer journey.
Testing remains the foundation of measurable growth, but many companies still underuse it. Research shows that 68.2% of organizations run fewer than four A/B tests each month. Even so, 77% conduct some form of experimentation on their websites.
This limited testing cadence leaves performance insights untapped and slows data-driven progress.
Even worse, only one in eight A/B tests delivers a statistically significant result. That gap usually comes from poor hypothesis design or small sample sizes.
Pro tip: If you’re dealing with the same issues, we’ve reviewed the most experienced CRO teams that can help you with a better segmentation and experimentation strategy.
The impact of doing it right is clear.
Testing landing pages alone can increase conversion rates by up to 30%. This proves that experimentation validates ideas and directly improves ROI and decision-making confidence across marketing and product teams.
CRO spending patterns show a wide gap between recognition and action. DemandSage reports that while CRO can take up to 30% of the marketing budget, 53% of companies still allocate less than 5% to optimization activities.
According to the same report, businesses spend around $2,000 a month on CRO tools on average. This is an amount that usually limits experimentation depth and scalability.
Big Sur’s analysis paints an even leaner picture. It estimates that companies dedicate just 1.08% of their total budgets to improving conversion rates. This minimal investment contrasts sharply with the returns CRO can deliver when executed strategically.
Interestingly, Xander Marketing notes that early-stage startups under $2 million in ARR invest far more aggressively. They allocate 20-40% of revenue to marketing, with a meaningful share going into CRO and early growth initiatives. This shows how younger teams view optimization as a direct growth driver worth prioritizing.
Accessibility remains one of the biggest missed opportunities in conversion optimization. WebAIM’s 2025 report found that 94.8% of home pages still have at least one WCAG 2 accessibility failure.
On average, each page contains 6.3 form fields, and over a third of those are missing proper labels. What's even more concerning is that 79.1% of sites still display low-contrast text. This is a design flaw that makes key actions harder to complete for many users.
If you’re dealing with these issues, you need to fix them because the connection between usability and revenue is clear.
Tenet reports that a well-designed interface can increase conversions by up to 200%. Meanwhile, a strong overall UX can deliver lifts in conversion rates of up to 400%.
So, investing in these improvements is really smart.
In fact, increasing the UX development budget by 10% correlates with an 83% rise in conversions.
However, the consequence of ignoring UX is just as strong. 88% of users say they’re less likely to return to a website after a poor experience.
The data above shows that conversion optimization leads to consistent, measurable improvement. Each percentage point of lift compounds over time, especially when your strategy aligns data, design, and growth execution.
More importantly, investing in CRO delivers a stronger ROI than spending the same amount on new traffic. Every tested variation, speed improvement, or personalization layer moves you closer to sustainable performance.
Here’s what these insights mean for your team:
Together, these statistics prove that CRO is a strategic advantage that compounds value across every stage of your funnel.
Using CRO means getting more from the traffic you already have, so you don’t need to focus on just driving new visitors. The goal is to maximize ROI by turning each impression into a measurable outcome. In other words, your focus moves from traffic growth alone to improving conversion and experience quality at every step.
And you can get support whenever you need it to maximize CRO across your teams.
Our sister company, inBeat Agency, can help you achieve this through data-driven creative testing, user-generated content, and performance optimization. Its team refines touchpoints, scales paid media, and builds authentic creator content that drives trust and conversion lift.
If you want measurable growth, contact inBeat Agency to turn insight into impact.
CRO stands for Conversion Rate Optimization, which is the process of improving how effectively your website or app turns visitors into customers. It focuses on measurable actions like form submissions, signups, or purchases. These are supported by structured testing and analytics.
CRO itself isn’t a KPI but a process that improves the KPIs tied to growth. These KPIs can include conversion rate, cost per acquisition, and ROI. Monitoring them helps you evaluate how design, copy, and experience changes impact your results.
The best results come from systematic testing. So, you should run A/B experiments, improve speed, simplify forms, and use behavioral data to remove friction. Each change should be guided by data because relying only on assumptions won't cut it today.
Yes. Even small conversion lifts compound over time. This can help you improve marketing efficiency and revenue without increasing ad spend or traffic.