Important tool updates - Learn more
- Learn
-
Articles
Read about influencer marketing
-
Growthnotes - Newsletter
Insights for the modern marketer
You’ve probably noticed how much harder it’s become to hit the same returns on Facebook advertising as a few years ago. Rising CPMs, privacy changes, and more competition all mean that the “good” Facebook ad ROAS you used to aim for may no longer be realistic.
That doesn’t mean you can’t scale profitably, it just means you need the right benchmarks and sharper context to guide your decisions.
In this article, you’ll see what performance really looks like, compare industry benchmarks, and learn practical ways to improve results.
Let’s start by clarifying what ROAS actually measures and why it matters.
P.S. Looking for a partner to squeeze the most out of Meta ads? Check out our curated list of Top Meta Advertising Agencies. It features expert teams that can help you scale smarter and improve your ROAS with proven strategies.
A strong Facebook Ads ROAS in 2025 typically falls between 2X and 4X, depending on your industry, margins, and growth goals.
The overall median ROAS across industries is 2.19, but benchmarks vary widely: automotive parts average 6.76 while B2B SaaS averages 1.60.
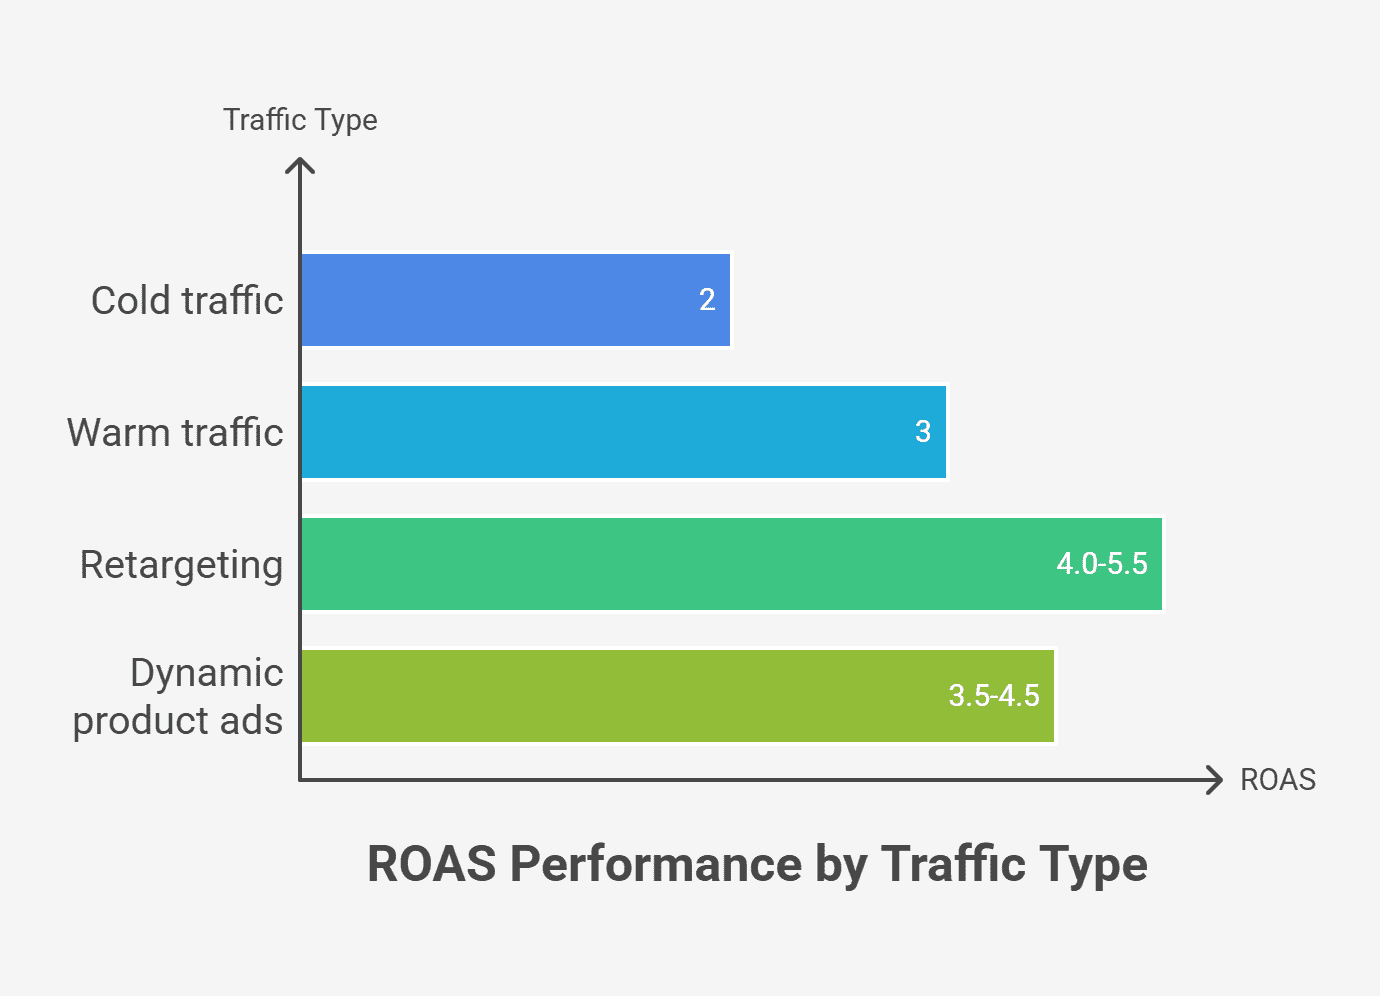
Cold traffic often performs at 2X ROAS, warm audiences at 3X, and retargeting between 4.0 and 5.5.
High ROAS does not always mean profitable growth. Retargeting and attribution lag can inflate results.
Break-even ROAS should be your baseline before scaling. Example: $100 product with 40% margin = 2.5X break-even.
Creative testing every 2–4 weeks, ABO for testing and CBO for scaling, and gradual 10–20% budget increases are proven ways to sustain healthy ROAS.
Attribution models, blended ROAS, and incrementality testing give a truer picture of real performance.
Complement ROAS with MER, CAC, LTV, and payback period to guide smarter scaling decisions.
Case example: inBeat helped Hurom achieve a blended ROAS of 6.06 through creative testing, social proof, and influencer-led content.
Bottom line: Aiming for 2X–4X ROAS is realistic in 2025, but the most reliable benchmarks come from your own margins, customer data, and channel mix.
ROAS, or return on ad spend, tells you how much revenue you generate for every dollar spent on an ad campaign.
ROAS Formula = Revenue ÷ Ad Spend
Unlike ROI, which accounts for all costs in your business, ROAS isolates the direct efficiency of your advertising budget. That makes it a key metric for Facebook marketers who need to justify budgets quickly and make informed scaling decisions.
On average, ecommerce businesses report about a 2.87:1 ROAS across industries, which means that $2.87 is earned for every $1 invested in ads.
This figure doesn’t guarantee profit since it ignores margins, order value, and overhead. Still, it gives you a realistic benchmark to compare performance in Facebook Ads Manager or across channels.
For marketers looking to move beyond revenue-focused ROAS and accurately measure real campaign profitability after costs, consider using a profit on ad spend report.
This daily report lets you track exactly how much gross profit each advertising dollar generates once COGS and pricing impact are accounted for, supporting smarter budgeting and strategic decisions.
Here's a more detailed explanation (if you need to learn more about this):
Next, let's see why consistently tracking ROAS is beneficial.
Tracking ROAS helps you understand the true financial impact of every campaign. If you monitor it regularly, you create a direct link between spend and results that guides better decisions across your ad portfolio.
The main benefits that you can expect are:
But how does this metric fit into your wider campaign strategy?
ROAS is useful on its own, but it becomes far more powerful when you connect it with other financial metrics. Your customer lifetime value (LTV), cost per acquisition (CAC), and average order value (AOV) all shape how much return you actually need to be profitable. An LTV:CAC ratio of at least 3:1 is typically cited as a healthy benchmark, though the exact target varies by industry and growth stage.
If you rely on Facebook ROAS alone, you risk misreading performance. For example, a campaign might show 5x return in-platform, but blended reporting could reveal only 1.8x after factoring in other channels.
That gap directly affects CAC and payback period, which limits how much you can reinvest. Using blended ROAS helps validate true performance and prevents scaling campaigns that look profitable but fail to support sustainable growth.
Moving on, we'll explain what counts as a good ROAS in 2025.
In 2025, a good ROAS for Facebook Ads falls between 2X and 4X.
This range reflects higher ad costs and more complex tracking compared to past years. As you may know, many marketers used to point to a 3X return as the standard, which means spend one dollar and generate three in revenue. While this benchmark still holds in some sectors, hitting that level consistently is harder today.
It’s also important to separate break-even ROAS from your target. Break-even tells you the minimum return needed to cover your costs, while your target should factor in growth goals, customer acquisition efficiency, and overall return on investment.
A campaign showing 2.5x ROAS might look healthy on paper, but if your margins are thin, it could still underperform against business needs.
Industry averages can vary widely, so setting the right target means looking beyond a single number. The median overall Facebook Ads ROAS is 2.19, but results shift a lot by sector.
To give you a clear view, here are the most recent Facebook Ads ROAS benchmarks reported across industries. These figures show how different the returns can be depending on your target audience, product margins, and campaign type:
| Industry | Facebook Ads ROAS |
|---|---|
| Automotive Parts | 6.76 |
| Hotels | 4.83 |
| Furniture | 4.67 |
| SEO Services | 4.60 |
| Home Appliances | 4.24 |
| Insurance Services | 4.24 |
| Delivery Services | 4.13 |
| Home Improvement | 3.94 |
| Travel Services | 3.52 |
| Kitchenware | 3.28 |
| Marketing & Advertising Agencies | 3.16 |
| Textiles | 2.90 |
| Baby Care | 2.49 |
| Banking Solutions | 1.92 |
| Consulting Services | 1.88 |
| Pet Care | 1.69 |
| Food & Beverage | 1.69 |
| B2B SaaS | 1.60 |
| Subscriptions | 1.60 |
| Beauty | 1.57 |
| Education | 1.54 |
| Personal Care | 1.48 |
| Mental Health Services | 1.46 |
| Wellness | 1.45 |
| Software Development Services | 1.40 |
| Ed Tech | 1.34 |
| B2C SaaS | 1.32 |
| Medical Services | 1.28 |
| Healthcare | 1.19 |
| Healthcare Products | 1.19 |
| Financial Services | 0.57 |
| Nutrition Services | 0.38 |
| Telehealth | 0.15 |
These numbers underline a key point: benchmarks are relative. What looks weak in one vertical might be considered strong in another. A furniture brand seeing 4X is right in line with benchmark expectations, while a SaaS company might do well at 1.5X given longer sales cycles and higher customer value.
ROAS benchmarks shift depending on where your audience sits in the funnel. Cold traffic behaves differently from retargeting, so using the same target across campaigns can distort performance.
Here’s what recent benchmarks suggest:
A high ROAS looks great on a dashboard, but it doesn’t always mean you’re driving real business growth. Retargeting is a good example. When you focus on past buyers, the numbers usually look impressive, but many of those sales would likely have happened without the ads. The result is inflated metrics that don’t reflect new customer journeys or incremental revenue.
The truth is that extremely high ROAS can sometimes hurt scale. Testing frameworks show that reducing ROAS targets by 10-15% creates a better balance between volume and profitability. Chasing the “perfect” ratio can hold back reach and limit long-term gains.
Attribution lag makes this even more complex. Delayed conversion value reporting can make campaigns look stronger than they actually are. This risk grows when you rely only on platform-reported numbers, such as Facebook Pixel.
So the real challenge is not just maximizing ROAS but learning how to sustain it while scaling. Let’s look at the strategies you can use to keep performance healthy without capping growth potential.
Improving ROAS means building a structure that balances profit with growth and adapts as conditions shift. Here are some strategies you can use to keep your returns stable and scalable.
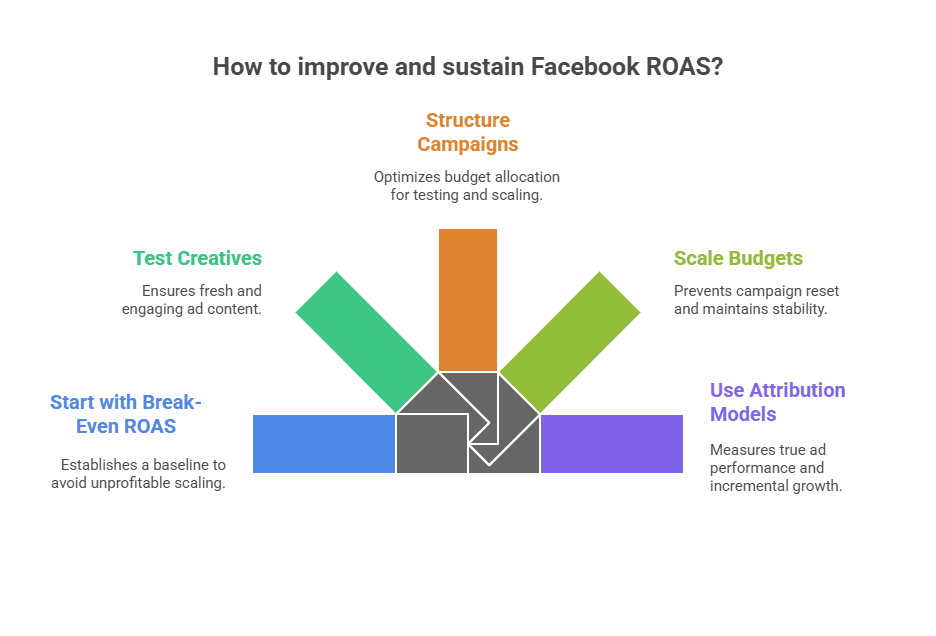
The smartest starting point is your break-even ROAS. This is the minimum return needed to cover costs. You can calculate it with a simple formula:
Break-Even ROAS = Average Order Value ÷ Profit Margin
For example, if your product sells for $100 with a 40% margin, your break-even ROAS is 2.5X. Knowing this baseline helps you avoid chasing arbitrary industry benchmarks that don’t fit your business.
It also prevents scaling campaigns that look profitable in-platform but actually erode your margins once overhead and fulfilment are included.
Creative is usually the biggest driver of results in Facebook ad campaigns. A structured A/B testing framework is important. You can test one variable at a time, such as headline, image, or CTA, so you know what actually impacts performance.
Watch for signs of ad fatigue. Falling click-through rates or rising cost per conversion mean it’s time to refresh. But also, don’t rely on one format. Tools like an AI ad generator can quickly produce variations to test different formats and messaging. Rotate between video, carousel, and collection ad formats to engage audiences differently and extend creative shelf life.
Refreshing creatives every 2–4 weeks can sustain performance and prevent plateauing. In fact, advertisers who refresh their creative bi‑weekly saw a 33% CTR improvement compared to those who didn’t
How you structure campaigns directly impacts profitability. Ad Set Budget Optimization (ABO) gives you tighter control for testing small segments and finding winning angles. Campaign Budget Optimization (CBO), on the other hand, is more efficient for scaling once you know where to allocate spend.
Many experienced advertisers run ABO at the testing stage and shift to CBO when scaling. To avoid volatility, use split testing when moving budgets, so you don’t risk tanking ROAS by rolling everything into a single campaign too quickly.
Scaling well requires discipline. Gradual budget increases of 10-20% prevent campaigns from resetting and keep Facebook’s delivery stable. You can also use lookalike layering, starting with 1% and expanding to 3% or 5%, to widen reach while staying close to your best buyers.
Monitor overlap closely, since targeting the same interest-based audiences across campaigns can inflate costs and reduce efficiency. To avoid creative burnout, rotate new concepts every few weeks. This is critical during peak cycles like Black Friday or Christmas, when competition drives CPMs higher.
A high ROAS inside Facebook doesn’t always mean high incremental growth. That’s why you need to compare attribution models. You can review 7-day click / 1-day view results, but also look at blended outcomes across your digital marketing channels.
Post-purchase surveys can confirm whether ads actually influenced a sale, while advanced teams run incrementality testing or Marketing Mix Modeling (MMM) to measure lift. This helps you cut back on vanity spend and double down on ads that move the needle on real revenue.
Remember, strong ROAS comes from structure and not from chance.
Creative execution is one of the most powerful levers for improving ROAS in 2025. That’s because audiences tune out generic ads quickly, but campaigns that mix the right creative formats with strong targeting can outperform industry averages.
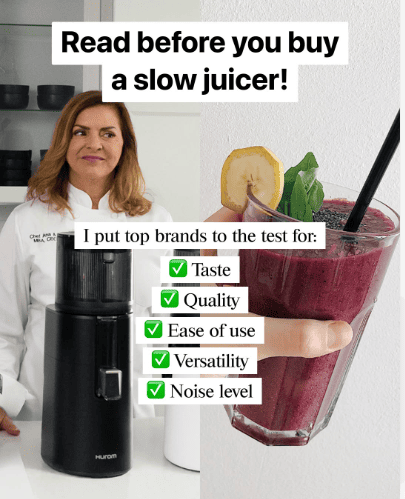
One example comes from inBeat’s collaboration with Hurom. The brand wanted to scale sales during key seasonal campaigns while keeping ROAS high.
Our team built a mix of static and video assets while testing elements like strike-through pricing, social proof, and educational copy. We also used whitelisted ads from creators such as Ana Machado and Spring Kitchen to add authenticity and authority to the campaigns.
The outcome was clear. Hurom achieved a blended ROAS of 6.06 in the US, with testimonial-based content and expert-led videos driving repeat top performance. Creative testing combined with targeted distribution allowed us to scale profitably while outperforming industry averages.
ROAS is only one part of the equation. To scale with confidence, you need to weigh other performance metrics as well that tie marketing spend directly to financial outcomes.
These are the ones worth prioritizing:
Facebook’s reported ROAS usually inflates performance because it attributes conversions to the last ad touchpoint, even when another channel played a larger role. For example, a customer might click a Facebook ad after first engaging with Google Search or an email campaign, but Ads Manager will still claim the sale.
That’s where blended ROAS comes in. It gives you a truer view of efficiency by dividing total revenue by total paid spend across all channels.
Blended ROAS = Total Revenue ÷ Total Paid Spend Across All Channels
Attribution lag makes this even more complex. A purchase might be logged days after the first click. But if you only rely on 7-day click or 1-day view windows, the credit won’t align with actual purchase behavior.
To close that gap, you can use modeled attribution in Google Analytics 4, run post-purchase surveys asking customers what influenced their decision, or apply incrementality tests to isolate lift.
There’s no universal number that defines success with Facebook ads. A ROAS of 2X–4X is typically considered a strong result, though the exact target depends on your margins, audience, and industry.
The truth is, your best benchmarks come from your own margins, customer data, and channel mix. That’s why you need to experiment, measure consistently, and benchmark against both your past performance and your peers.
If you want expert support building campaigns that scale profitably, our team at inBeat can help. Book a call with us today.
You can track ROAS directly in Facebook Ads Manager by dividing revenue attributed to your ads by total ad spend. For a clearer view, compare this to blended ROAS across channels.
A good ROI depends on your margins and goals, but it typically ranges from 2:1 to 5:1. Unlike ROAS, ROI is broader because it factors in all business costs, not just ad spend.
Platform-reported ROAS typically overstates performance since it uses limited attribution windows. To improve accuracy, you can use Google Analytics, post-purchase surveys, or first-party tracking tools alongside Facebook data.
Check ROAS against your break-even point, which depends on CAC and margins. For example, if your break-even is 2.5x, anything below that loses money even if it looks strong in-platform.